Aggregate statistics computed from the full SuppDB catalogue: 17,625 supplement and nootropic labels from the NIH Dietary Supplement Label Database, 115,051 active-ingredient listings normalised to milligrams, with a label ID and URL on every record. Snapshot of 2026-07-07. Every figure is free to cite, quote and embed with a link to this page.
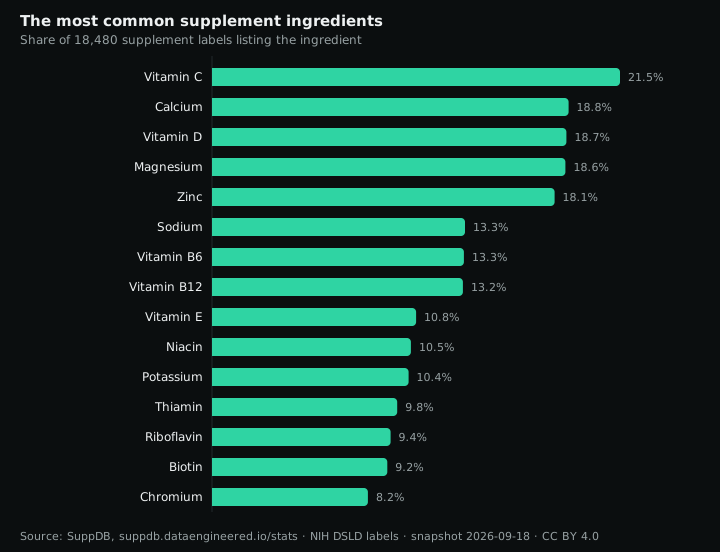
Vitamin C is on 18.6% of supplement labels, Calcium on 16.7% and Magnesium on 16.6%. The most common botanical is Ashwagandha at 8.0%.
Paste the snippet into your post. It links the chart back to this page, which is the only attribution we ask for.
<a href="https://suppdb.dataengineered.io/stats/#top-ingredients"><img src="https://suppdb.dataengineered.io/stats/charts/top-ingredients.svg" alt="The most common supplement ingredients" width="720" style="max-width:100%;height:auto"></a>
<p><small>Source: <a href="https://suppdb.dataengineered.io/stats/">SuppDB supplement statistics</a> (CC BY 4.0)</small></p>| Ingredient | Products | Share of products |
|---|---|---|
| Vitamin C | 3,283 | 18.6% |
| Calcium | 2,936 | 16.7% |
| Magnesium | 2,926 | 16.6% |
| Vitamin D | 2,841 | 16.1% |
| Zinc | 2,715 | 15.4% |
| Sodium | 2,207 | 12.5% |
| Vitamin B6 | 1,815 | 10.3% |
| Vitamin B12 | 1,778 | 10.1% |
| Potassium | 1,633 | 9.3% |
| Niacin | 1,415 | 8.0% |
| Ashwagandha | 1,408 | 8.0% |
| Vitamin E | 1,379 | 7.8% |
| Thiamin | 1,275 | 7.2% |
| Riboflavin | 1,215 | 6.9% |
| Biotin | 1,117 | 6.3% |
| Creatine | 1,110 | 6.3% |
| Chromium | 1,091 | 6.2% |
| Manganese | 1,072 | 6.1% |
| Selenium | 1,050 | 6.0% |
| Fish Oil | 949 | 5.4% |
Share of labels listing the ingredient as an active (Supplement Facts panel), counted once per product whatever the specific form; Vitamin D covers cholecalciferol and ergocalciferol, Magnesium every salt. Excipients and other ingredients are not counted.
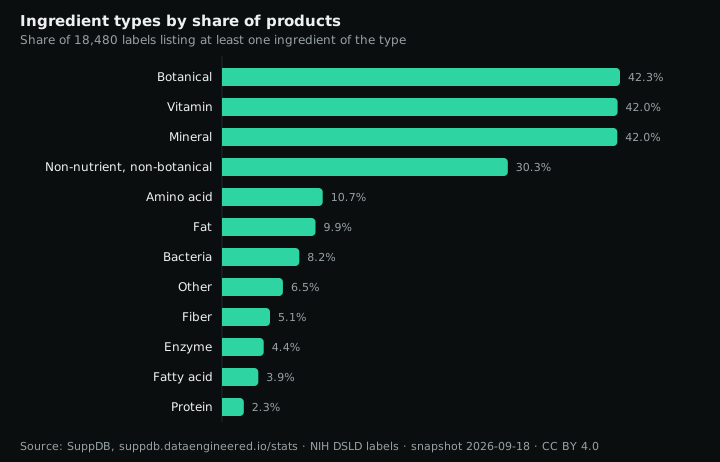
41.8% of labels list at least one botanical ingredient, 39.6% a vitamin and 39.5% a mineral. Probiotic bacteria appear on 8.1% of labels.
Paste the snippet into your post. It links the chart back to this page, which is the only attribution we ask for.
<a href="https://suppdb.dataengineered.io/stats/#categories"><img src="https://suppdb.dataengineered.io/stats/charts/categories.svg" alt="Ingredient types by share of products" width="720" style="max-width:100%;height:auto"></a>
<p><small>Source: <a href="https://suppdb.dataengineered.io/stats/">SuppDB supplement statistics</a> (CC BY 4.0)</small></p>| Ingredient type | Products | Share |
|---|---|---|
| Botanical | 7,362 | 41.8% |
| Vitamin | 6,988 | 39.6% |
| Mineral | 6,954 | 39.5% |
| Non-nutrient, non-botanical | 5,027 | 28.5% |
| Amino acid | 1,783 | 10.1% |
| Fat | 1,761 | 10.0% |
| Bacteria | 1,434 | 8.1% |
| Other | 1,061 | 6.0% |
| Fiber | 897 | 5.1% |
| Enzyme | 701 | 4.0% |
| Fatty acid | 681 | 3.9% |
| Protein | 386 | 2.2% |
Ingredient type is the NIH DSLD ingredient group of each active. A product counts once per type it contains, so shares sum to more than 100%.
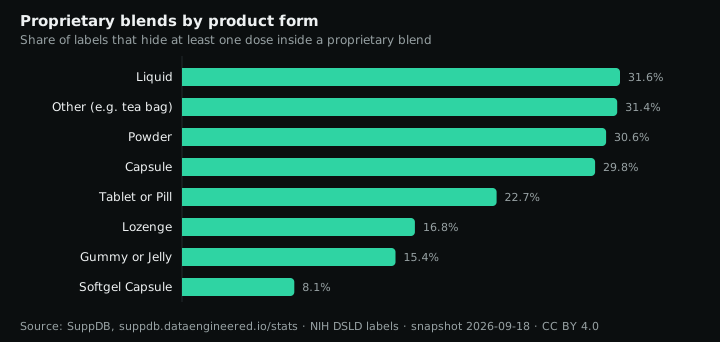
24.6% of supplement labels use a proprietary blend, which lists ingredients without their individual amounts. As a result 37.7% of all 115,051 ingredient listings carry no per-ingredient dose. Liquid products hide doses most often (31.2%), Softgel Capsule least (8.1%).
Paste the snippet into your post. It links the chart back to this page, which is the only attribution we ask for.
<a href="https://suppdb.dataengineered.io/stats/#proprietary-blends"><img src="https://suppdb.dataengineered.io/stats/charts/proprietary-blends.svg" alt="Proprietary blends by product form" width="720" style="max-width:100%;height:auto"></a>
<p><small>Source: <a href="https://suppdb.dataengineered.io/stats/">SuppDB supplement statistics</a> (CC BY 4.0)</small></p>| Product form | Products | With a proprietary blend | Share |
|---|---|---|---|
| Liquid | 1,721 | 537 | 31.2% |
| Capsule | 6,204 | 1,815 | 29.3% |
| Powder | 3,401 | 978 | 28.8% |
| Other (e.g. tea bag) | 529 | 146 | 27.6% |
| Tablet or Pill | 2,766 | 546 | 19.7% |
| Lozenge | 161 | 27 | 16.8% |
| Gummy or Jelly | 637 | 97 | 15.2% |
| Softgel Capsule | 2,173 | 175 | 8.1% |
A listing is flagged as a proprietary blend when the label groups it under a blend total instead of stating its own amount; the blend flag and the missing amount are both taken from the NIH DSLD label record. Forms with fewer than 100 products are omitted.
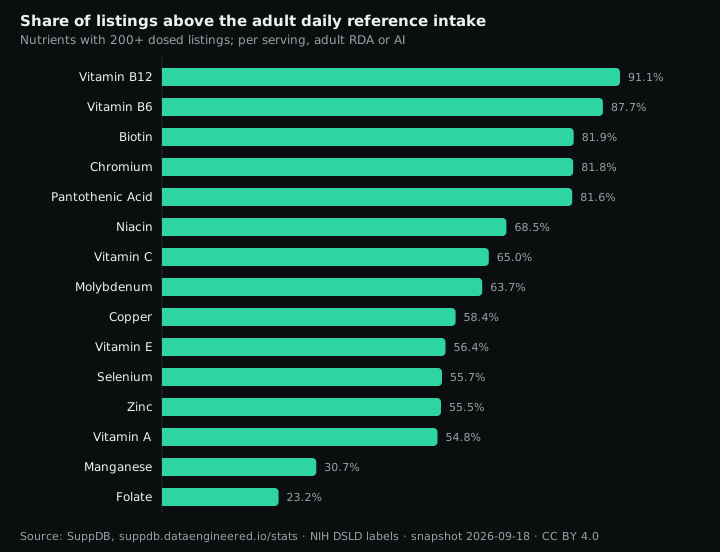
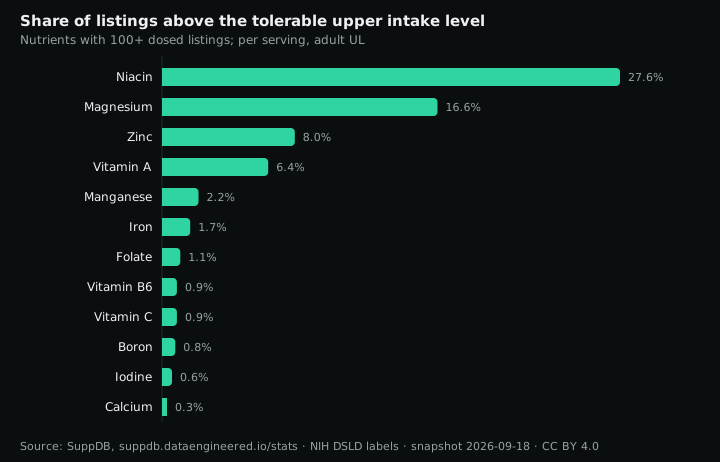
Per serving, 91.9% of Vitamin B12 listings exceed the adult daily reference intake, as do 88.8% of Vitamin B6 and 84.3% of Biotin listings. Against the tolerable upper intake level, the line most often crossed is Niacin: 30.1% of its dosed listings exceed the adult UL per serving, followed by Magnesium (19.5%) and Zinc (9.7%).
Paste the snippet into your post. It links the chart back to this page, which is the only attribution we ask for.
<a href="https://suppdb.dataengineered.io/stats/#above-daily-value"><img src="https://suppdb.dataengineered.io/stats/charts/above-daily-value.svg" alt="Share of listings above the adult daily reference intake" width="720" style="max-width:100%;height:auto"></a>
<p><small>Source: <a href="https://suppdb.dataengineered.io/stats/">SuppDB supplement statistics</a> (CC BY 4.0)</small></p>Paste the snippet into your post. It links the chart back to this page, which is the only attribution we ask for.
<a href="https://suppdb.dataengineered.io/stats/#above-upper-limit"><img src="https://suppdb.dataengineered.io/stats/charts/above-upper-limit.svg" alt="Share of listings above the tolerable upper intake level" width="720" style="max-width:100%;height:auto"></a>
<p><small>Source: <a href="https://suppdb.dataengineered.io/stats/">SuppDB supplement statistics</a> (CC BY 4.0)</small></p>| Nutrient | Dosed listings | Above daily reference | Share | Reference (mg per day) |
|---|---|---|---|---|
| Vitamin B12 | 1,797 | 1,651 | 91.9% | 0.0024 |
| Vitamin B6 | 1,820 | 1,617 | 88.8% | 1.3 |
| Biotin | 1,117 | 942 | 84.3% | 0.03 |
| Pantothenic Acid | 293 | 238 | 81.2% | 5 |
| Chromium | 1,133 | 918 | 81.0% | 0.035 |
| Vitamin C | 3,308 | 2,262 | 68.4% | 90 |
| Niacin | 1,428 | 973 | 68.1% | 16 |
| Molybdenum | 649 | 429 | 66.1% | 0.045 |
| Copper | 947 | 565 | 59.7% | 0.9 |
| Zinc | 2,842 | 1,630 | 57.4% | 11 |
| Vitamin E | 1,456 | 829 | 56.9% | 15 |
| Selenium | 1,061 | 589 | 55.5% | 0.055 |
| Vitamin A | 919 | 499 | 54.3% | 0.9 |
| Manganese | 1,094 | 368 | 33.6% | 2.3 |
| Folate | 883 | 214 | 24.2% | 0.4 |
| Iodine | 846 | 184 | 21.7% | 0.15 |
| Iron | 849 | 119 | 14.0% | 18 |
| Magnesium | 3,047 | 359 | 11.8% | 400 |
| Calcium | 2,986 | 122 | 4.1% | 1000 |
| Choline | 598 | 7 | 1.2% | 550 |
| Sodium | 2,091 | 5 | 0.2% | 1500 |
| Potassium | 1,613 | 1 | 0.1% | 3400 |
| Nutrient | Dosed listings | Above UL | Share | UL (mg per day) |
|---|---|---|---|---|
| Niacin | 1,428 | 430 | 30.1% | 35 |
| Magnesium | 3,047 | 595 | 19.5% | 350 |
| Zinc | 2,842 | 277 | 9.7% | 40 |
| Vitamin A | 919 | 80 | 8.7% | 3 |
| Manganese | 1,094 | 35 | 3.2% | 11 |
| Iron | 849 | 18 | 2.1% | 45 |
| Folate | 883 | 17 | 1.9% | 1 |
| Iodine | 846 | 15 | 1.8% | 1.1 |
| Vitamin B6 | 1,820 | 21 | 1.2% | 100 |
| Vitamin C | 3,308 | 38 | 1.1% | 2000 |
| Selenium | 1,061 | 9 | 0.8% | 0.4 |
| Boron | 633 | 4 | 0.6% | 20 |
| Molybdenum | 649 | 4 | 0.6% | 2 |
| Calcium | 2,986 | 8 | 0.3% | 2500 |
| Copper | 947 | 1 | 0.1% | 10 |
| Vitamin E | 1,456 | 1 | 0.1% | 1000 |
| Choline | 598 | 0 | 0.0% | 3500 |
Reference values are the NIH Office of Dietary Supplements adult RDA or AI and tolerable upper intake level (UL), stored per nutrient in milligrams. Comparisons are per labelled serving, not per day, and only listings with a stated amount are counted. Exceeding the RDA is common and often intended; the UL for magnesium applies to supplemental intake only and the UL for niacin to nicotinic acid, so read these as label facts, not as a safety verdict. Some products are formulated for use under medical supervision.
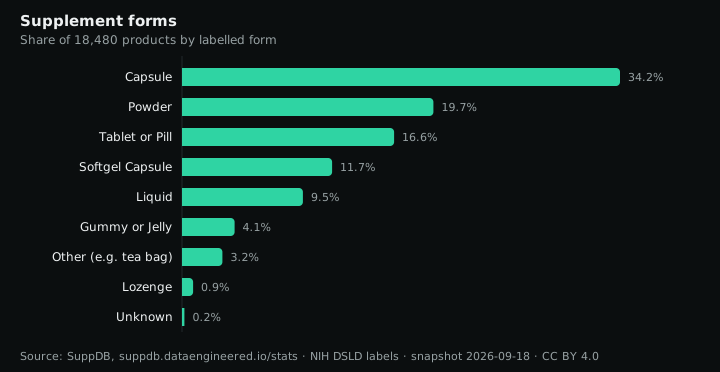
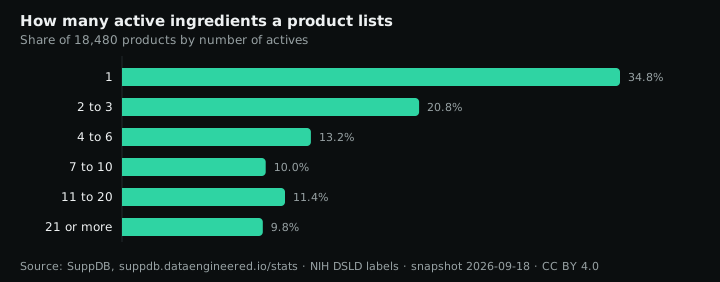
35.2% of products are capsules, 19.3% powders and 15.7% tablets or pills. 36.4% of products contain a single active ingredient; the median product has 2, the mean 6.5, and the most complex formula lists 206. A container holds a median of 50 servings.
Paste the snippet into your post. It links the chart back to this page, which is the only attribution we ask for.
<a href="https://suppdb.dataengineered.io/stats/#forms"><img src="https://suppdb.dataengineered.io/stats/charts/forms.svg" alt="Supplement forms" width="720" style="max-width:100%;height:auto"></a>
<p><small>Source: <a href="https://suppdb.dataengineered.io/stats/">SuppDB supplement statistics</a> (CC BY 4.0)</small></p>Paste the snippet into your post. It links the chart back to this page, which is the only attribution we ask for.
<a href="https://suppdb.dataengineered.io/stats/#ingredients-per-product"><img src="https://suppdb.dataengineered.io/stats/charts/ingredients-per-product.svg" alt="How many active ingredients a product lists" width="720" style="max-width:100%;height:auto"></a>
<p><small>Source: <a href="https://suppdb.dataengineered.io/stats/">SuppDB supplement statistics</a> (CC BY 4.0)</small></p>| Form | Products | Share |
|---|---|---|
| Capsule | 6,204 | 35.2% |
| Powder | 3,401 | 19.3% |
| Tablet or Pill | 2,766 | 15.7% |
| Softgel Capsule | 2,173 | 12.3% |
| Liquid | 1,721 | 9.8% |
| Gummy or Jelly | 637 | 3.6% |
| Other (e.g. tea bag) | 529 | 3.0% |
| Lozenge | 161 | 0.9% |
| Unknown | 33 | 0.2% |
| Actives | Products | Share |
|---|---|---|
| 1 | 6,420 | 36.4% |
| 2 to 3 | 3,825 | 21.7% |
| 4 to 6 | 2,413 | 13.7% |
| 7 to 10 | 1,802 | 10.2% |
| 11 to 20 | 1,871 | 10.6% |
| 21 or more | 1,294 | 7.3% |
Form is the label's own dosage form as recorded by NIH DSLD. Servings per container are stated on 14,948 of 17,625 labels (interquartile range 30 to 90).
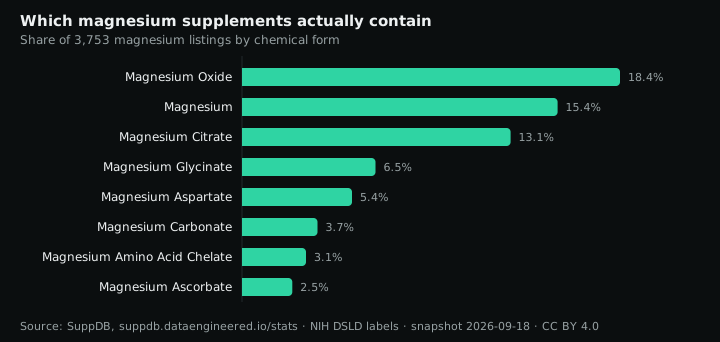
Magnesium Oxide is the most common magnesium form at 15.9% of magnesium listings, ahead of Magnesium Citrate (14.3%) and Magnesium Glycinate (7.6%); 14.4% of listings name no salt at all. Caffeine is dosed on 240 labels at a median of 150 mg per serving (mean 163 mg, maximum 400 mg); 56 of them exceed 200 mg in one serving.
Paste the snippet into your post. It links the chart back to this page, which is the only attribution we ask for.
<a href="https://suppdb.dataengineered.io/stats/#magnesium-forms"><img src="https://suppdb.dataengineered.io/stats/charts/magnesium-forms.svg" alt="Which magnesium supplements actually contain" width="720" style="max-width:100%;height:auto"></a>
<p><small>Source: <a href="https://suppdb.dataengineered.io/stats/">SuppDB supplement statistics</a> (CC BY 4.0)</small></p>| Magnesium form | Listings | Share |
|---|---|---|
| Magnesium Oxide | 506 | 15.9% |
| Magnesium | 456 | 14.4% |
| Magnesium Citrate | 453 | 14.3% |
| Magnesium Glycinate | 241 | 7.6% |
| Magnesium Aspartate | 188 | 5.9% |
| Magnesium Carbonate | 129 | 4.1% |
| Magnesium Amino Acid Chelate | 105 | 3.3% |
| Magnesium Ascorbate | 76 | 2.4% |
Magnesium form is the specific ingredient named on the label; a label that lists the element without a salt is shown as Magnesium. Caffeine figures use listings with a stated amount, whether from caffeine anhydrous or a caffeine-standardised extract.
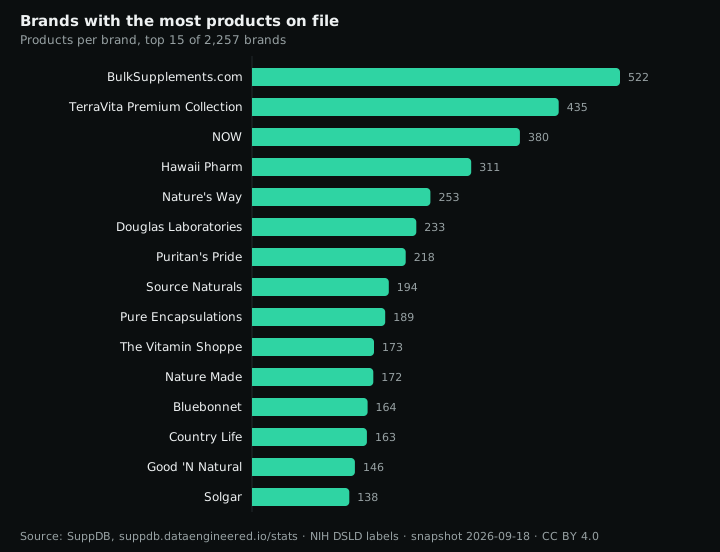
BulkSupplements.com has the most labels on file with 522, ahead of TerraVita Premium Collection (435) and NOW (379). The catalogue spans 2,194 brands; most have a handful of products.
Paste the snippet into your post. It links the chart back to this page, which is the only attribution we ask for.
<a href="https://suppdb.dataengineered.io/stats/#top-brands"><img src="https://suppdb.dataengineered.io/stats/charts/top-brands.svg" alt="Brands with the most products on file" width="720" style="max-width:100%;height:auto"></a>
<p><small>Source: <a href="https://suppdb.dataengineered.io/stats/">SuppDB supplement statistics</a> (CC BY 4.0)</small></p>| Brand | Products |
|---|---|
| BulkSupplements.com | 522 |
| TerraVita Premium Collection | 435 |
| NOW | 379 |
| Hawaii Pharm | 311 |
| Douglas Laboratories | 228 |
| Puritan's Pride | 217 |
| Source Naturals | 194 |
| Nature's Way | 187 |
| Pure Encapsulations | 179 |
| Nature Made | 171 |
| The Vitamin Shoppe | 169 |
| Bluebonnet | 164 |
| Country Life | 159 |
| Good 'N Natural | 145 |
| Solgar | 138 |
Brand names are as printed on the label and recorded by NIH DSLD. Counts reflect how many of a brand's labels are in the database, not its market share.
Every label with its ingredients, milligram doses, blend flags, forms, serving counts and PubChem chemistry, as SQLite, CSV and JSON.
Get the full dataset ($49) →